An intraday chart can be very confusing when you're first getting into it. The candles are moving so fast, the prices are going up and down all the time and the indicators often appear to be pointing in different directions. The issue isn't just about spotting a price move. It's about understanding what the chart is actually telling you before you make a decision as to whether you enter a trade or not.
Intraday charts are useful for traders in that they can be used to study price action over the course of a single trading day. They can show short term trends, potential support and resistance, trading volume and changes in momentum. The problem with any chart or indicator though is that it can't tell you where the price is going next.
Here's what to look at prior to placing an intraday trade.
Table of Contents
1. Start With the Right Time Frame
Intraday charts show price action over various time frames. The most common ones are the 1min, 5min, 15min and 30min charts.
A 1 minute chart will show a lot of price action and can be useful for traders looking at short term moves. It can also be very noisy. The 5 minute chart gives a bit more perspective. The 15 and 30 minute charts will give you a better idea of the direction of the session.
You don't necessarily have to adhere to every time frame. Start with one that works for your trading style and then use a higher time frame to get a sense of the overall trend.
For instance if a stock is moving up on the 15 minute chart and then shows a short dip on the 5 minute chart that could be a temporary pullback rather than a full trend reversal. It would still need confirmation before you'd consider it.
2. Understand Candlestick Patterns
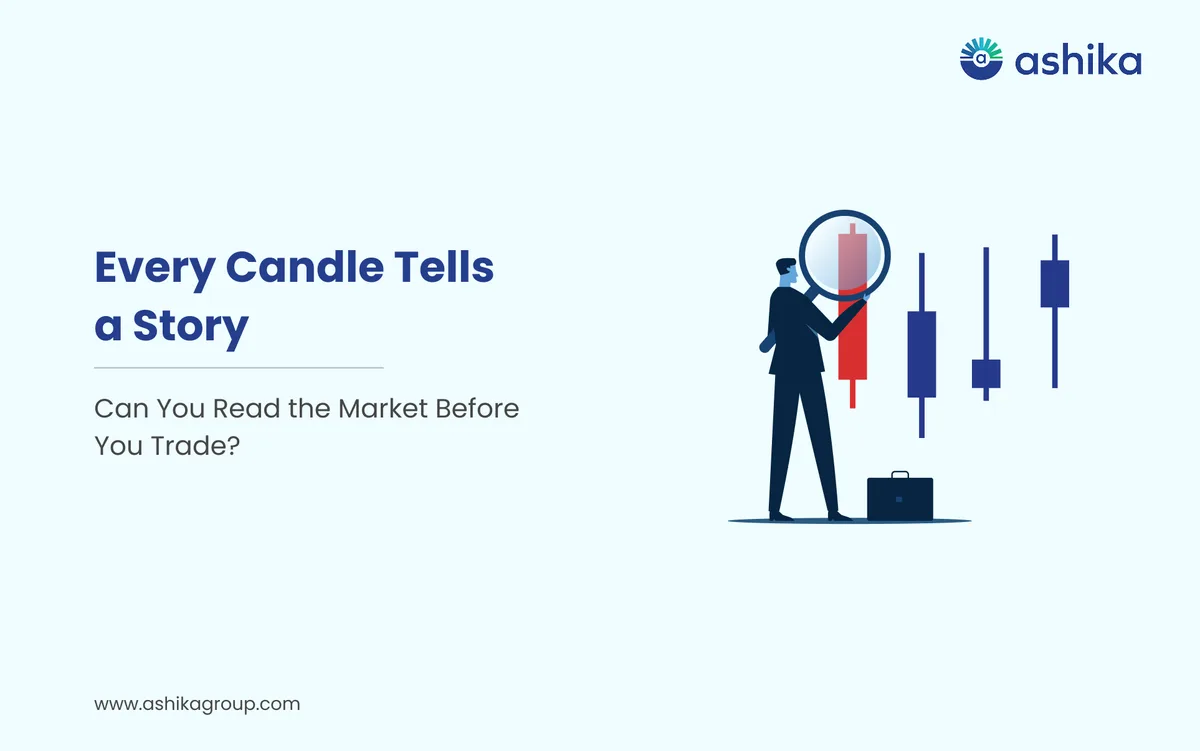
Candlestick charts are used extensively in intraday trading as each candle gives you the open, high, low and close.
The body of the candle shows the difference between the open and close. The upper and lower wicks show the highest and lowest prices achieved during that period.
A green candle signifies that the close was above the open, a red candle that the close was below the open (though of course you can change the colours of course).
A long body candle may be indicative of strong buying or selling pressure during that period. Long wicks can indicate that the price moved a long way but failed to sustain that move.
Still one candle shouldn't be the basis of a trading decision. Its position, the price action around it and the volume are all important.
3. Identify Support and Resistance
Support is a price area where buying interest has previously served to stop or slow a fall. Resistance is a price area where selling interest has previously served to stop or slow a rise.
These are zones not guaranteed turning points. Prices can definitely move through either one, especially when there's an increase in volume.
Before you place a trade look for areas where the price has previously paused, reversed or consolidated. Previous session highs and lows can also be useful reference points.
Suppose the stock is repeatedly having trouble getting above ₹500. If it gets back to that level again, you'd look at whether it reverses or breaks above the level with some real volume. A breakout on its own doesn't necessarily mean that the price will go on and on.
4. Check Volume Alongside Price
Price tells you where the stock is trading; volume tells you how many shares have changed hands over that period.
Volume can be used by traders to determine whether a price move has genuine participation behind it. A break above resistance with higher than normal volume is likely to attract more attention than a similar break on weak volume.
Similarly a price fall accompanied by rising volume could be an indicator of increased selling.
Volume should not be looked at in isolation. You can certainly see a spike in volume around a news event, a market announcement or the like and that doesn't in any way tell you what prices will do next.
5. Use Indicators Carefully
Technical indicators can be useful for structuring the chart data, but the addition of too many can in fact make the decision harder.
Moving averages can be used to establish the general direction of a trend. The RSI measures the speed of recent price movement and is commonly used to gauge momentum. An RSI reading above 70 doesn't necessarily mean the stock is going to fall and an RSI reading below 30 doesn't necessarily mean it's going to turn around.
Some traders will also use VWAP (Volume Weighted Average Price) to compare the current price to the session's volume weighted average.
Pick a small number of indicators that you actually understand. Look for concordance between price action, volume and the indicator rather than simply taking one of the signals as your reason to go in.
6. Plan Entry, Stop-Loss and Exit Beforehand
Reading a chart is only half the battle in intraday trading. Before you place an order you have to decide what price action would confirm your trade idea and what price action would indicate that your trade idea was no longer valid.
A stop loss can be of some assistance in limiting your losses should the market move against you, though the actual execution prices may vary during periods of rapid movement or gaps. You should also bear in mind the potential loss in relation to the potential reward.
For example if you have a hypothetical trade with an entry at ₹200 and a stop loss at ₹197 the price risk is ₹3 per share (excluding charges and slippage). The number of shares you can trade is a function of how much loss you can afford, not simply how much margin you have available.
Don't get into a trade simply because a candle looks good. If the setup isn't clear and the risk is too high then it's perfectly reasonable to wait.
Ready to open yours?
Free account opening · Paperless eKYC · Live in 10 minutes
Final Thoughts
Reading intraday charts takes practice. You need to get to know the timeframes, candlesticks, support and resistance, volume and a handful of basic indicators. Then you need to have a clear plan in place for entry, stop loss and exit prior to actually placing the order.
Charts can be of great help in terms of getting the trader to organise the information, but they can't in any way remove the uncertainty of the market. Practising with historical charts and/or in a demo environment will go a long way to build up your familiarity before you start to trade with your own money.
Platforms like the Ashika Dhanush 2.0 app offer access to a range of market tools and information which traders can use as part of their research. Any trade decision should be based on your own risk profile, your own analysis and your own understanding of the potential for loss.
Frequently Asked Questions
Which time frame is best for Intraday chart analysis?
The 5-minute and 15-minute charts can help traders study short-term price movements and the broader session trend. The choice depends on your trading style and the level of detail you need.
What do candlesticks indicate in an Intraday chart?
Each candlestick shows the open, high, low and close for a specific period. Its body represents the difference between the opening and closing prices, while its wicks show the highest and lowest prices reached.
How do support and resistance help in Intraday trading?
Support and resistance help identify price zones where buying or selling interest has previously slowed or reversed a move. Traders can observe how the price behaves around these levels before considering a trade.
Why is volume important when reading Intraday charts?
Volume indicates how many shares have changed hands during a particular period. Higher-than-normal volume during a breakout may suggest stronger market participation, while rising volume during a fall may indicate increased selling activity.
Which indicators are commonly used for Intraday chart analysis?
Moving averages help assess the general trend, RSI is commonly used to gauge momentum, and VWAP compares the current price with the session's volume-weighted average. Traders should understand the indicators they use and consider them alongside price action and volume.
Was this article helpful?
Thanks for your feedback!

 6 min read